
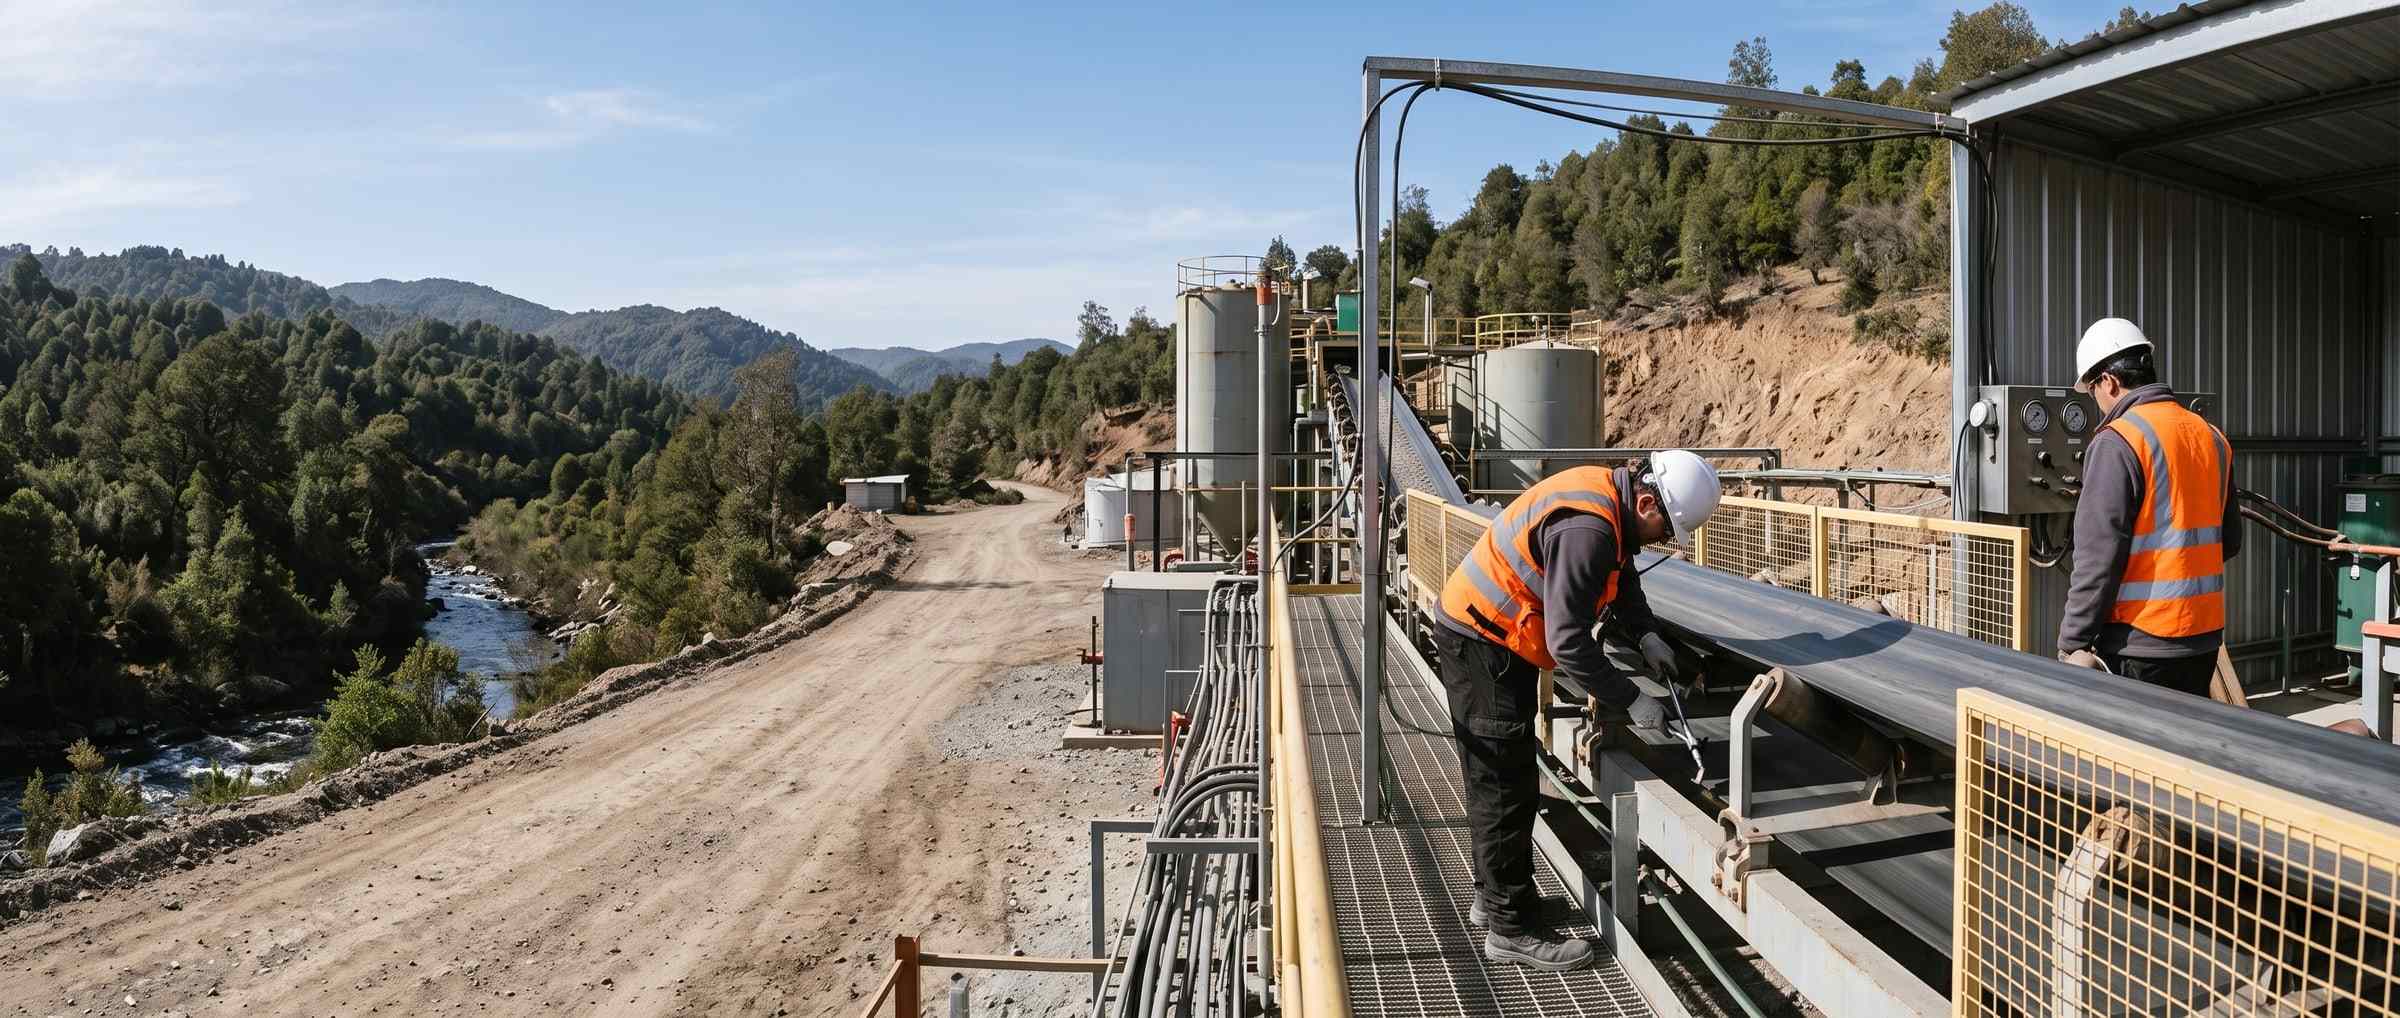
Field data for more sustainable management.
Adopting new technologies makes it possible to move towards more efficient and sustainable operations. PAIR digitises and automates field processes, making it easier to manage data and measure environmental impact.
SDGs PAIR contributes to
More at un.org/sustainabledevelopment. The content of this publication has not been approved by the United Nations and does not reflect the views of the United Nations or its officials or Member States.
Where the impact is
-
Trips
The office trip a remote review replaces: 199.73 g CO₂e per kilometre not driven.
-
Paper
The sheet that is not printed: 6.71 g CO₂e each, thirty sheets per kilometre of pickup.
-
Emissions
The activity data, with its factor and its source, ready for the inventory your team builds.
The subtraction, in public#
An A4 sheet weighs 6.71 g CO₂e of production; a kilometre in a diesel 4x4 pickup, 199.73 g. One kilometre weighs the same as thirty sheets, and a 120 km round trip, seven reams.
Paper counts, and we count it. But the big number is in the trip that was not made: the office specialist’s, who used to go up to see the site and now walks it recorded.
The four figures, with their source#
UK Government GHG Conversion Factors for Company Reporting 2025 (DESNZ). The last two are the first two divided.
6.71g CO₂e
Per A4 sheet of 80 g/m², production only.
199.73g CO₂e
Per kilometre in a diesel 4x4 pickup, scope 1.
30sheets
What one kilometre of that pickup weighs, in paper.
7.1reams
What a 120 km round trip weighs.
The same crew from the example, in paper and in kilometres#
Twelve inspectors, one hundred and twenty-five records a month each.
| The calculation | What it gives |
|---|---|
| Records a year | 12 × 125 × 12 = 18,000 records. |
| Sheets not printed | 18,000 × 2 pages = 36,000 sheets, or 72 reams. |
| Paper emissions | 36,000 × 6.71 g = 241.6 kg CO₂e a year. |
| Kilometres not driven | 48 remote reviews × 120 km = 5,760 km, only if your team confirms each one replaced a trip. |
| Emissions of those trips | 5,760 × 199.73 g = 1,150.4 kg CO₂e a year. |
| Total for the example | 1.39 tonnes of CO₂e a year: 116 kg per inspector. |
[ the table continues to the right ]
How much paper and how many trips stop happening is set by your operation; the table says what each one weighs.
What the person signing the annual report asks#
Why does this page appear this year and not last year?
Because the current financial year is the first reported under IFRS S1 and IFRS S2 (CMF General Rule 519).
Which part of the occupational safety report comes from the field?
The numerator: the incidents and the hours, which is what gets recorded on site (General Rule 461, item 5.6; Supreme Decree 44, art. 73).
Can I subtract from my inventory the CO₂ that PAIR avoided?
No, and nobody can: the GHG Protocol accounts for emissions that occurred, not emissions avoided. What goes down is your scope 1 when the site buys fewer litres.
Why is the default factor British and not Chilean?
Because there is no downloadable Chilean table with paper and per-kilometre vehicle factors; the British one is public and updated every year. If you have your own, yours is used.